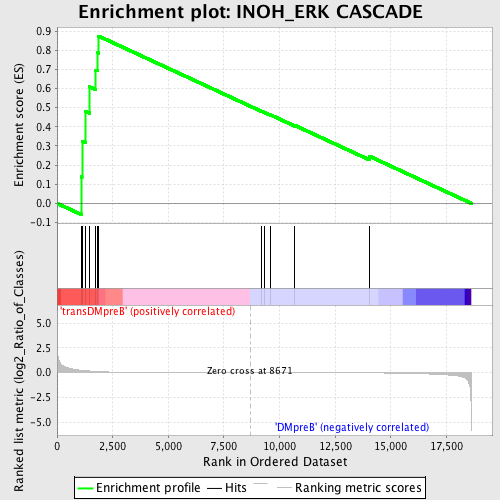
Profile of the Running ES Score & Positions of GeneSet Members on the Rank Ordered List
| Dataset | Set_04_transDMpreB_versus_DMpreB.phenotype_transDMpreB_versus_DMpreB.cls #transDMpreB_versus_DMpreB.phenotype_transDMpreB_versus_DMpreB.cls #transDMpreB_versus_DMpreB_repos |
| Phenotype | phenotype_transDMpreB_versus_DMpreB.cls#transDMpreB_versus_DMpreB_repos |
| Upregulated in class | transDMpreB |
| GeneSet | INOH_ERK CASCADE |
| Enrichment Score (ES) | 0.87331843 |
| Normalized Enrichment Score (NES) | 1.4593179 |
| Nominal p-value | 0.033932135 |
| FDR q-value | 0.8745338 |
| FWER p-Value | 1.0 |
| PROBE | DESCRIPTION (from dataset) | GENE SYMBOL | GENE_TITLE | RANK IN GENE LIST | RANK METRIC SCORE | RUNNING ES | CORE ENRICHMENT | |
|---|---|---|---|---|---|---|---|---|
| 1 | PRKCD | 21897 | 1081 | 0.237 | 0.1385 | Yes | ||
| 2 | MAP2K1 | 19082 | 1120 | 0.227 | 0.3249 | Yes | ||
| 3 | MAPK3 | 6458 11170 | 1268 | 0.198 | 0.4811 | Yes | ||
| 4 | RAF1 | 17035 | 1454 | 0.166 | 0.6088 | Yes | ||
| 5 | PRKCZ | 5260 | 1742 | 0.124 | 0.6963 | Yes | ||
| 6 | MAP2K2 | 19933 | 1831 | 0.114 | 0.7860 | Yes | ||
| 7 | ARAF | 24367 | 1869 | 0.108 | 0.8733 | Yes | ||
| 8 | PRKCE | 9575 | 9168 | -0.001 | 0.4819 | No | ||
| 9 | PRKCQ | 2873 2831 | 9311 | -0.001 | 0.4754 | No | ||
| 10 | PRKCI | 9576 | 9604 | -0.002 | 0.4614 | No | ||
| 11 | PRKCH | 21246 | 10681 | -0.005 | 0.4074 | No | ||
| 12 | PRKCA | 20174 | 14043 | -0.023 | 0.2458 | No |

